[Data Science Project] What Drives Intra-State Migration? A Network Regression Analysis on Florida Counties
Introduction
Understanding internal migration patterns within a state offers deep insights into social equity, economic opportunity, and regional planning. In this blog post, I analyze county-to-county migration flows in Florida between 2016 and 2020 using network-based regression methods. As this project is an extended project from last post, so if you are interested in this intra-Florida migration analysis, please refer to this link. Specifically, I applied the Multiple Regression Quadratic Assignment Procedure (MR-QAP) to identify which socioeconomic and spatial factors influence migration ties.
Data Overview
-
Migration Flows: Origin-destination data among Florida counties (2016–2020), filtered to include only flows with weight > 0.
-
County Attributes: Socioeconomic indicators like median income, racial composition, education, employment, commute time, and housing age from the U.S. Census.
-
Geometry: Florida county shapefiles for spatial network construction.
Each county is treated as a node, and migration flow is a weighted edge in a directed graph.
Methodology: MR-QAP
MR-QAP is a network regression model that accounts for the autocorrelated structure of network data. Here’s what we did:
-
Dependent Matrix: Migration flow matrix between 67 Florida counties.
-
Independent Matrices: Pairwise absolute differences between counties in:
-
Median income
-
% White population
-
% African-American population
-
Degree centrality (connectedness)
-
% Employed
-
Average commute time
-
Median year built of housing
-
County area
-
Geographic distance between centroids
- Permutation Testing: 1000 permutations were run to compute p-values.
Results
| Variable | Coefficient (β) | p-value |
|---|---|---|
| Geographic Distance | -39.0901 | 0.0080 |
| Median Income Difference | -0.0017 | 0.4186 |
| % White Difference -2.3064 | 0.3477 | |
| % African-American Diff. | +5.5234 | 0.0959 |
| Degree Centrality Diff. | +0.0061 | 0.0180 |
| Employment Rate Diff. | -5.2510 | 0.8112 |
| Commute Time Difference | +9.2089 | 0.2907 |
| Median Built Year Diff. | +7.7797 | 0.1249 |
| Area Difference | +0.2053 | 0.0180 |
-
R² (model): 0.0183
-
R² (mean of permutations): 0.0052
Interpretation
-
Distance matters. Counties farther apart are less likely to be connected by migration.
-
Network centrality matters. Counties with similar migration importance (degree) tend to be connected.
-
Area size also shows a significant but small positive effect.
-
Income, race, and commute time show weaker or insignificant effects, suggesting spatial structure dominates over socioeconomic similarity.
Visualization
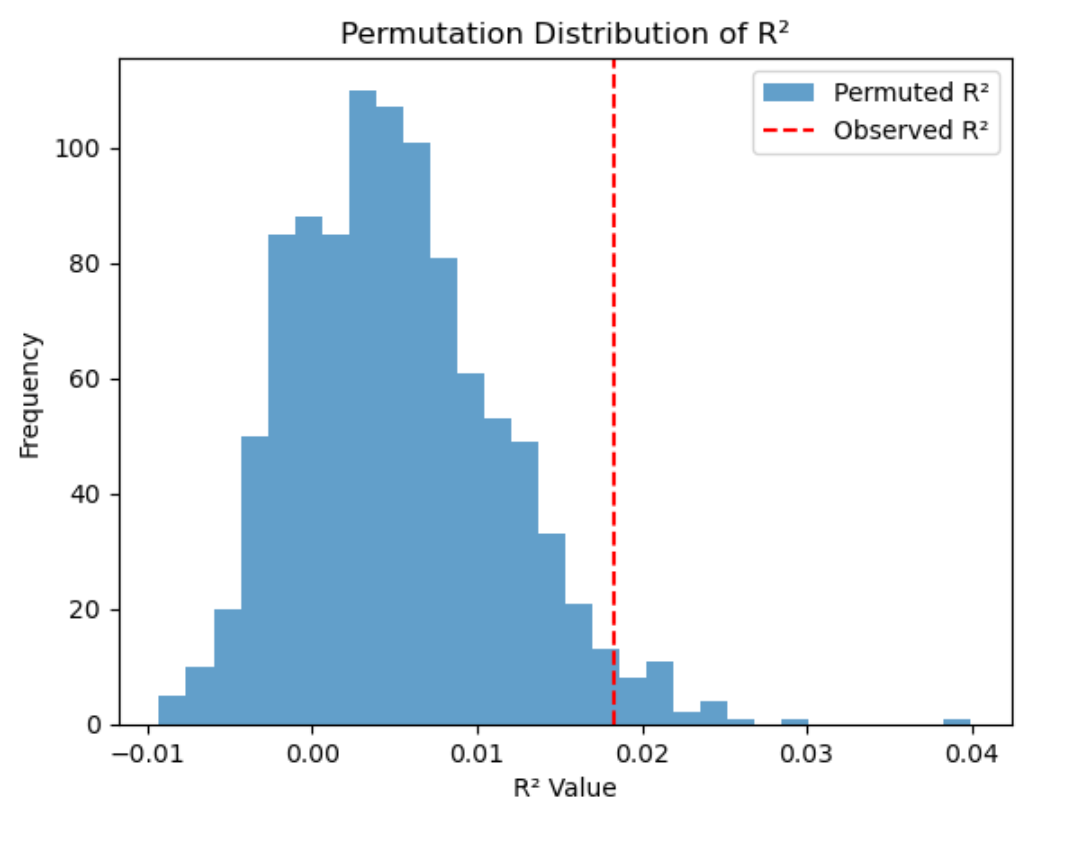
The observed R² of 0.0183 lies in the upper tail of the permutation distribution, confirming the model’s modest but non-random explanatory power.
Conclusion
This MR-QAP analysis reveals that physical proximity and network centrality are stronger predictors of county-to-county migration flows in Florida than demographic or economic similarity. This finding aligns with gravity-based theories of migration and has implications for infrastructure and service planning at the state level.
Thank you for reading!

Want to see more posts like this combining Python, mapping, and regression modeling? Hit like and subscribe to follow my data science journey!

Leave a comment