Global Agriculture revenue efficiency analysis based on climate change using R
Project description
This project was launched from team research in George Mason University course CDS 101, Introduction to Computational and Data Sciences. After learning basic modules in R, team size of 7 members conducted a research based on real-world based dataset. Data analysis and 40 minutes length presentation was completed after 5 weeks of project duration.
Analysis building
Imaginary Situation Setting
Imagine a circumstance where you work as a data scientist in a global agricultural company. You might have to choose where to build an agricultural farm and see the natural condition of the region, CO2 emission, extreme weather events, etc. At the same time, you might also need to determine which crop to cultivate for better income. By conducting an EDA, constructing hypotheses and models, and predictive analysis would show a result of what region and crop would bring higher income. Also, this research might give you a nice first-impression as a professional data scientist!
Research Question
To bring more economic revenue with less yield, what crops should be grown on which continent?
Hypothesis for whole research
Null Hypothesis : There is no significant difference in economic profit across different continents and crop types based on climate factors (average temperature, precipitation, extreme weather events), chemical factors (fertilizer use, pesticide use) and crop yield.
Alternative Hypothesis : Economic impact significantly differs across continents and crop types due to variations in climate factors and chemical inputs.
Response Variable: Economic profit
Explanatory Variable: Climate factors, Chemical factors, Crop Yield
Dataset
Dataset Explanation
Global_Agriculture_Climate_Impact_Dataset on Kaggle written by Talha Khalid. Recorded data about global agriculture and climate change.
This recorded dataset focuses on the impacts of climate change on agriculture, offering insights into environmental and agricultural variables across various countries and regions over multiple years.The Columns include temperature, precipitation, CO₂ emissions, extreme weather events, and agricultural inputs such as fertilizer and pesticide usage, irrigation access, and soil health index.
- Rows : 10,000 rows
- Columns: 15 columns
- Years : 1990 - 2024 (34 years)
| Data Type | Column Name | Category |
|---|---|---|
| Categorical | Year, Country,Region | Geographic, time information of data |
| Numerical | Average_Temperature_C, Total_Precipitation_mm, CO2_Emissions_MT, Extreme_Weather_Events | Climate Data |
| Numerical | Soil_Health_Index, Pesticide_Use_KG_per_HA, Fertilizer_Use_KG_per_HA | Chemical usage and Soil health index data |
| Numerical | Crop_Yield_MT_per_HA,Economic_Impact_Million_USD | Yield and Economic Impact Data |
Country contained: Argentina, Australia, Canada, China, France, India, Nigeria, Russia, and USA
- 9 countries
- Each country had muliples of regions
Crop type: Barley, Coffee, Corn, Cotton, Fruits, Rice, Soybeans, Sugarcane, Vegetables, and Wheat
- 10 crops
Background Information
- Healthy, sustainable and inclusive food systems are critical to achieve the world’s development goals.
- Agricultural development is one of the most powerful tools to end extreme poverty, boost shared prosperity, and feed a projected 10 billion people by 2050. Source
-
Global demand on agricultural products are rising.
-
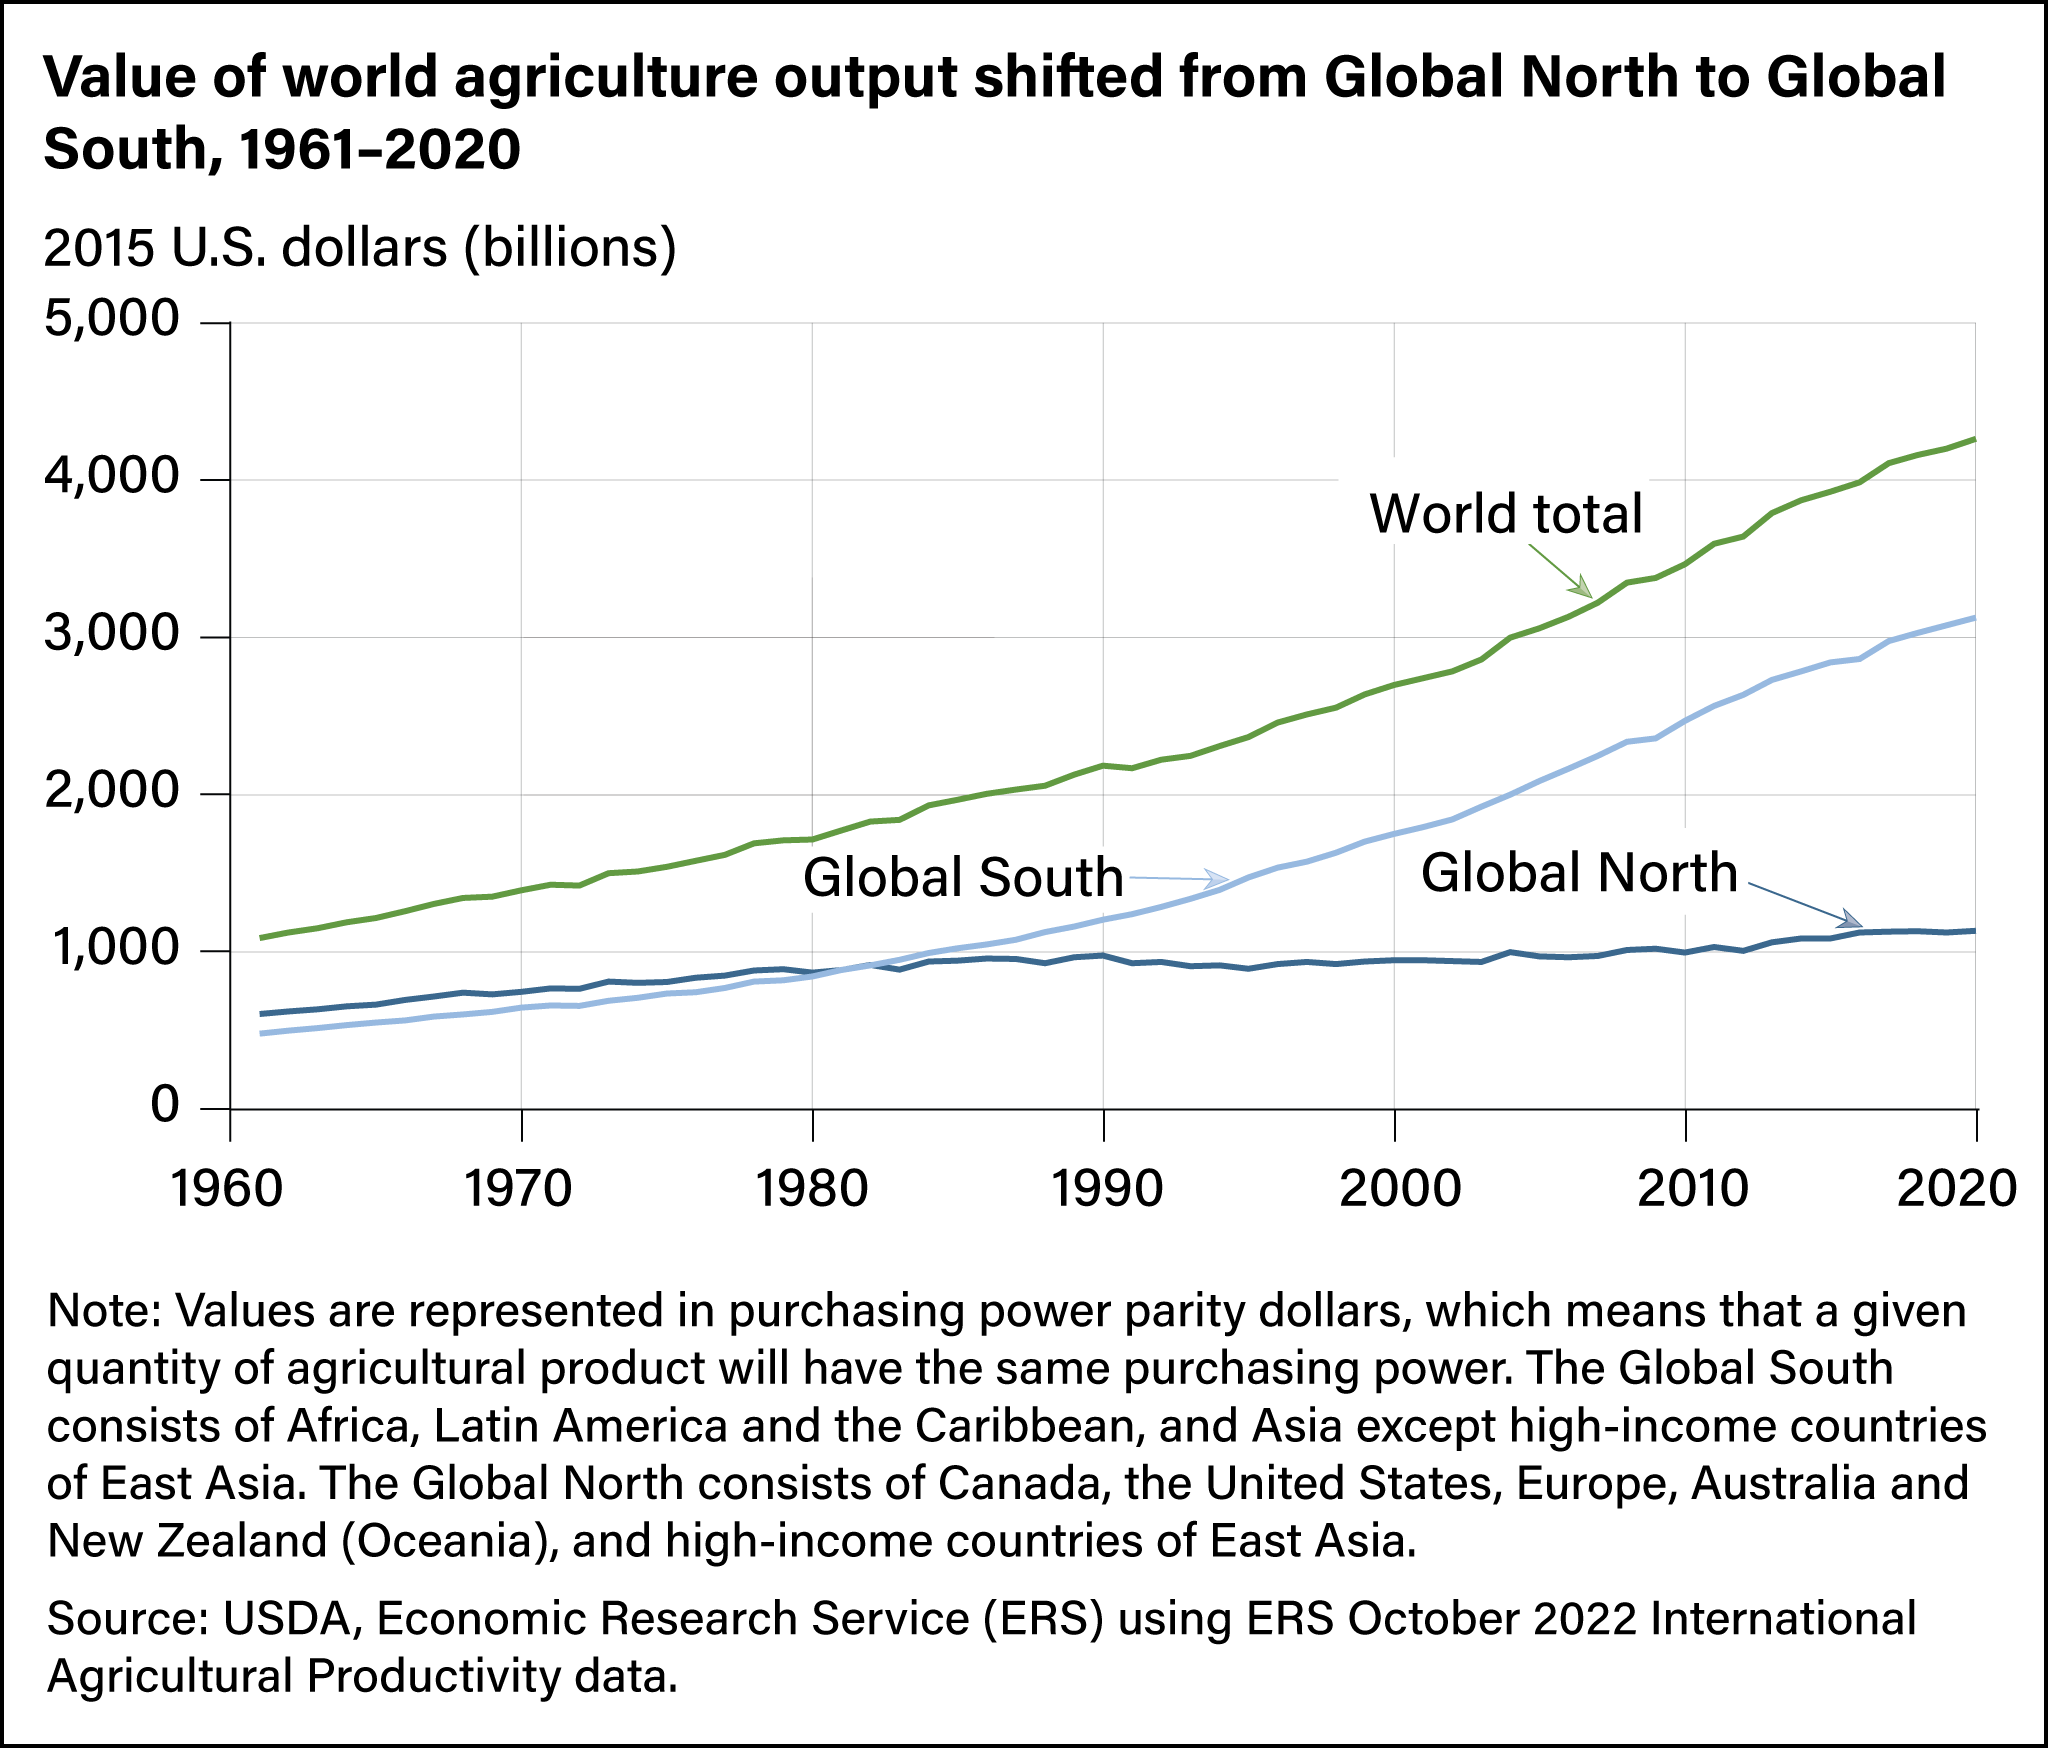
Global South is rapidly contributing for more agricultural income.
-
World Economic impact on agriculture is keep rising.

- Global distribution of farm size
-
No data for China in this Our World in Data Resource Source
- Oceania, South America, North America has huge size of farms
- In this research, we would deal with all those continents.
Future of Agriculture: Smart Farms
Smart Farm innovation Center in Gimjae, Jeonbook, South Korea
- SMART FARM: A farm that manages crops and livestock automatically by incorporating ICT into glass greenhouses, livestock houses, etc.
- Big Data Center manages data collected in agricultural activities.
- This Smart farm rent smart farm to young farmers and educate them.
Agriculture and Data Science
Predictive Analytics for Precision Farming
- Data Collection and Data Analytics
- Machine learning models to predict crop yields, water requirements, and pest infestations.
- Weather Predictions
- Decision Making: crop selection, harvest timing… Source
Real-World Examples of Data Science Applications
- Precision Irrigation in California
- Disease Prediction in Kenyan Vineyards
- Precision Nitrogen Application in Illinois
- Automated Weed Scouting Brazilian Soy farms
- Yield Prediction for Apple Orchards in New York Source
Flow plan of whole project
Data Pre-processing
Aggregation
Regions in one country should have been aggregated for each years. All values for same region and year is aggregated to one mean number.
Explanatory Data Analysis (EDA)
Continent: Which of the continent has less change in its climate? Crop Type: Which of the crop is the most resilient regardless of climate change?
- Rank by each visualization and get closer to the result.
Standard
- High intercept: refers high unit price
- Steeper slopes: imply higher economic returns per unit increase in crop yield.
- Ranked in order for this two standard mostly.
- Continent Which of the continent has less change in its climate?
- Box plot color different for each continent => compare easily.
- IQR and line length are smaller -> less change in its temperature
-
- Easy to forecast the average temperature.
- Rank for each continent :
| Rank | Continent |
|---|---|
| 1 | Europe |
| 2 | North America |
| 3 | South America |
| 4 | East Asia |
| 5 | Oceania |
| 6 | South Asia |
| 7 | Africa |
| 8 | Eurasia |

Leave a comment